Financial Highlights
Salini Impregilo Group
The “Alternative performance indicators” paragraph in the “Other information” section provides a definition of the indicators used to analyse the Group’s financial highlights.
The income statement data for the period 2014 were reclassified in accordance with IFRS 5.

Consolidated income statement
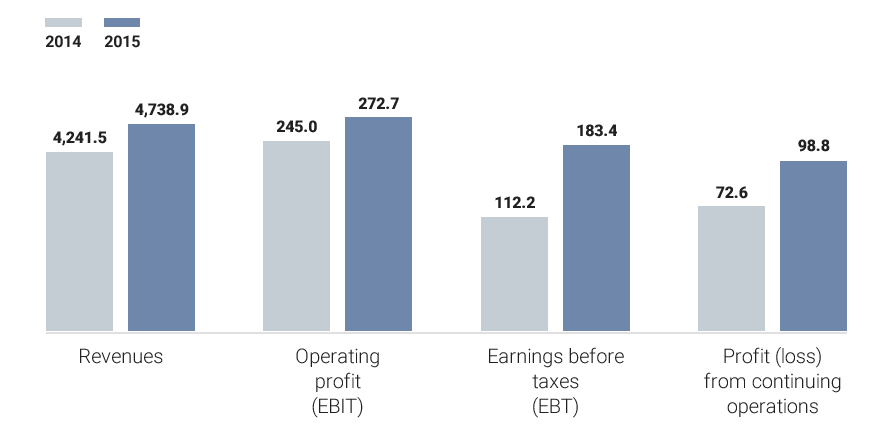
| (in millions of euro) | 2015 | 2014 (§) | |
|---|---|---|---|
| Revenue | 4,738.9 | 4,241.5 | |
| Operating costs (*) | (4,252.4) | (3,813.6) | |
| Gross operating profit (EBITDA) | 486.5 | 427.9 | |
| EBITDA % | 10.3% | 10.1% | |
| Operating profit (EBIT) | 272.7 | 245.0 | |
| R.o.S. | 5.8% | 5.8% | |
| Financing income (costs) | (89.6) | (141.8) | |
| Gains (losses) on investments | 0.3 | 9.0 | |
| Earnings before taxes (EBT) | 183.4 | 112.2 | |
| Income taxes | (84.6) | (39.6) | |
| Profit (loss) from continuing operations | 98.8 | 72.6 | |
| Profit (loss) from discontinued operations | (16.6) | 30.6 | |
| Profit (loss) for the period attributable to the owners of the parent | 60.6 | 93.8 |
(§) The income statement data for 2014 were reclassified in accordance with IFRS 5 according to the new transfer scheme of the Todini Costruzioni Generali Group.
(*) They include provisions and impairment losses for € 22.8 million.
Consolidated statement of financial position
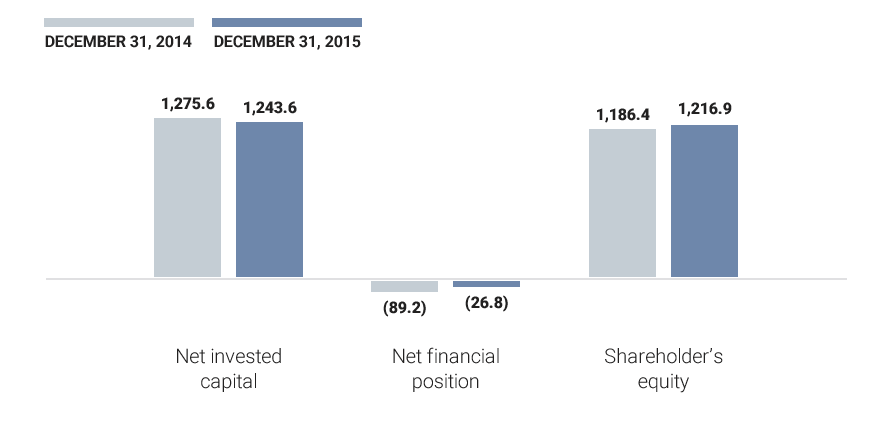
| (in millions of euro) | December 31, 2015 | December 31, 2014 |
|---|---|---|
| Non-current assets | 919.4 | 832.4 |
| Non-current assets (liabilities) held for sale | 41.6 | 84.1 |
| Provisions for risks, post-employment benefits and employee benefits | (131.8) | (120.8) |
| Net tax assets (liabilities) | 136.1 | 148.7 |
| Working capital | 278.3 | 331.3 |
| Net invested capital | 1,243.6 | 1,275.6 |
| Equity | 1,216.9 | 1,186.4 |
| Net financial position | 26.8 | 89.2 |
Salini Impregilo S.p.A. Income Statement
| (in millions of euro) | 2015 | 2014 | |
|---|---|---|---|
| Revenue | 3,027.2 | 2,341.9 | |
| Operating costs (*) | (2,708.4) | (2,116.0) | |
| Gross operating profit (EBITDA) | 318.8 | 225.9 | |
| EBITDA % | 10.5% | 9.6% | |
| Operating profit (EBIT) | 206.6 | 125.9 | |
| R.o.S. | 6.8% | 5.4% | |
| Financing income (costs) | (53.6) | (113.3) | |
| Gains (losses) on investments | (114.9) | 28.8 | |
| Earnings before taxes (EBT) | 38.0 | 41.4 | |
| Income taxes | (2.3) | (10.7) | |
| Profit (loss) from continuing operations | 35.7 | 30.7 | |
| Profit (loss) for the period attributable to the owners of the parent | 35.7 | 30.7 |
(*) They include provisions and impairment losses for € 33.9 million.
Salini Impregilo S.p.A. Statement of Financial Position
| (in millions of euro) | December 31, 2015 | December 31, 2014 |
|---|---|---|
| Non-current assets | 1,086.6 | 1,055.5 |
| Provisions for risks, post-employment benefits and employee benefits | (42.0) | (48.3) |
| Net tax assets (liabilities) | 60.5 | 18.6 |
| Working capital | 358.6 | 459.7 |
| Net invested capital | 1,463.7 | 1,485.6 |
| Equity | 937.4 | 943.0 |
| Net financial position | 526.4 | 542.6 |