Introductory remarks
Considering the circumstances that the acquisition of control by the former controlling company (now the incorporated company) Salini S.p.A. over the former controlled company (now the incorporated company) Impregilo S.p.A. occurred after the end of the first quarter of 2013 and the fact that the merger of Salini and Impregilo was completed after the acquisition of control by the former over the latter and thus qualified as a business combination of entities under common control in accordance with the IAS/IFRS principles, the consolidated income statement, statement of financial position and statement of cash flows of the Salini Impregilo Group at March 31, 2014, are presented in continuity with those of the Salini Group for the year ended December 31, 2013. Consequently, the following schedules are presented in this Interim report on operations for comparison purposes: (i) consolidated income statement of the Salini Group for the first quarter of 2013 and (ii) consolidated statement of financial position of the Salini Group at December 31, 2013. Therefore, and in view of the significant contribution that the activities owned by the former Impregilo provided in this Interim report on operations and the fact that these activities were not recognized in the Salini consolidated financial statements for the corresponding period in the previous year, as they were not controlled, for the sake of a more homogeneous understanding of the results for the first quarter of 2012 in comparison with those for the first quarter of the previous year, these comparative economic results were restated as if the Salini Group acquired control of Impregilo at an earlier data. This presentation, provided exclusively for information purposes, is shown and commented later in this report, in the section entitled “Performance of the Group’s operations in the first quarter of 2014.”
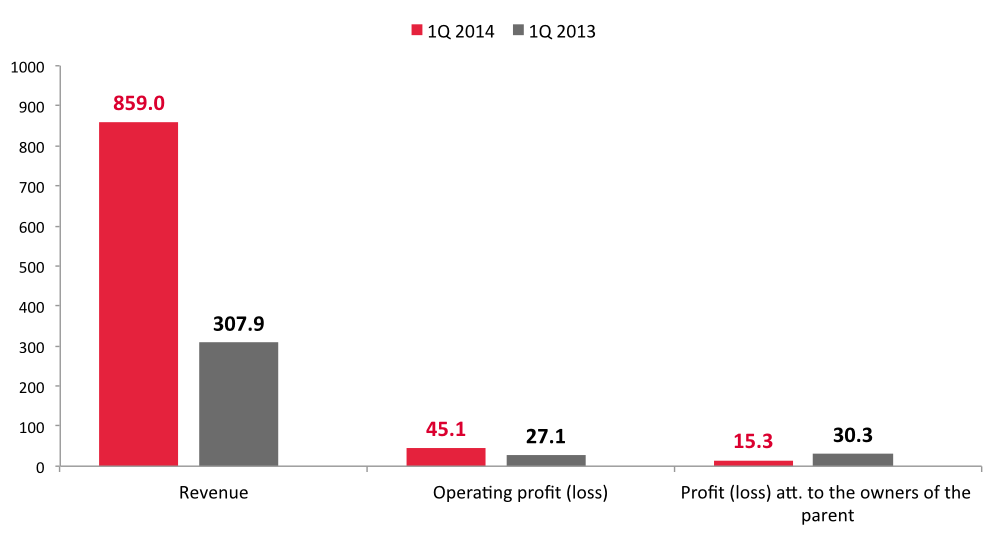
The Salini Impregilo Group ended the first quarter of 2014 with total revenues of 859,0 million euros (307.9 million euros in 2013), EBIT of 45.1 million euros (27.1 million euros for the first quarter 2013) and a net profit attributable to the owners of the parent amounting to 15.3 million euros (30.3 million euros for the first quarter 2013).
Owing in part to steady progress in the implementation of the plan to monetize and divest non-core activities, the relevant competitive scenario of the Salini Impregilo Group is currently represented by the global market for investments in the construction sector, with specific focus on the market for large, complex infrastructures.
At the international level, macroeconomic conditions show an improvement compared with the data for the previous year. According to recent estimates published by the OECD, the GDP of the 34 most developed economies should grow by 2.2% in 2014 and 2.8% in 2015. The global economy, however, should expand at a faster rate, growing by 3.4% in 2014 and 3.9% in 2015.
In this environment, the Salini Impregilo Group, while pursuing the strategic objective that underpin its industrial programs, as outlines in the 2014-2017 Industrial Plan approved on March 19, 2014, successfully pursued, in the first quarter of this year, new and important opportunities in its target markets, such as, for example, the new orders for projects involving the Lima subway system, in Peru, and the construction of the Brenner base tunnels, in Austria.
Lastly, please note that, in March 2014, consistent with the implementation of the plan to monetize the Group’s non-core assets, preliminary agreements were executed with external parties to sell the entire interest held by the Impregilo Group through Impregilo International Infrastructures N.V. in the German company Fisia Babcock Environment G.m.b.H. These agreements were finalized after the end of the first quarter of 2014 and, consequently, in the income statement, statement of financial position and statement of cash flows of the Group at March 31, 2014, the interest held in this company was reclassified into “Non-current assets held for sale,” as required by IFRS 5.
Group total revenue for the first quarter of 2014 totaled 859,0 million euros (307.9 million euros in the first three months of 2013 and 809.2 million euros on a homogeneous basis).1
EBIT were positive by 45.1 million euros (27.1 million euros in the first three months of 2013 and 50.5 million euros on a homogeneous basis), for a return on sales of 5.2%.
At the consolidated level, financing income (costs) and gains (losses) on investments generated net financing costs of 16.0 million euros in the first quarter of 2014 (net gain 15.5 million euros in the first three months of 2013 and net financing costs of 13.8 million euros on a homogeneous basis).
The profit from assets held for sale and discontinued operations, which amounted to 0.7 million euros (loss of 6.3 million euros in the first three months of 2013 and profit of 52.8 million euros on a homogeneous basis), reflects the results of the Todini Group (profit of 4.9 million euros), Fisia Babcock Environment (loss of 4.0 million euros) and of the USW Campania Projects (loss of 0.2 million euros). With regard to the latter, a comprehensive disclosure is provided later in this Interim report on operation, in the chapter entitled “Non-current Assets Held for Sale and Discontinued Operations.”
The consolidated net profit for the first quarter of 2014 attributable to the owners of the parent amounted to 15.3 million euros (30.3 million euros in the first three months of the previous year and 79.0 million euros on a homogeneous basis).
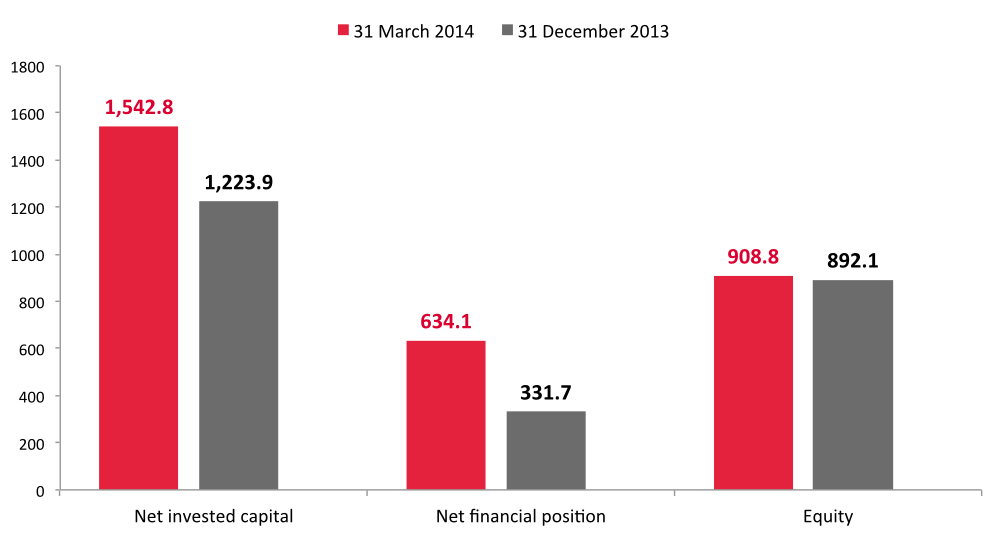
The consolidated net indebtedness of the continuing operations totaled 634.1 million euros at March 31, 2014, compared with 331.7 million euros at December 31, 2013.
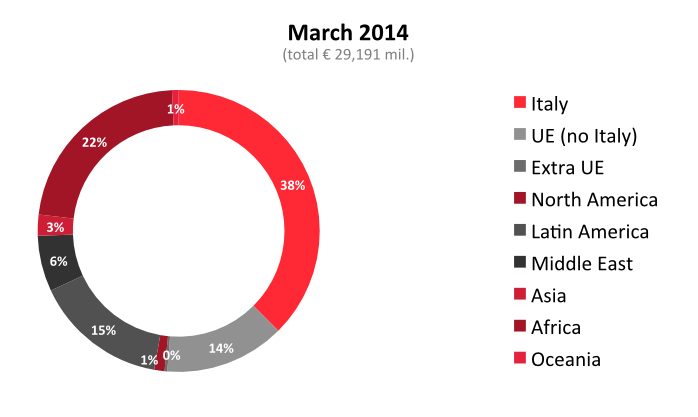
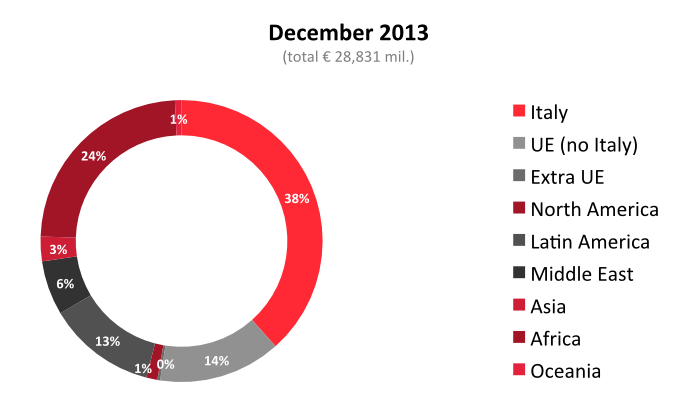
At March 31, 2014, the Group’s total order backlog amounted to 29.2 billion euros, including 7.1 billion euros in the portfolio of full-life concession projects.
New orders for the period totaled 1,557.3 million euros.
1 The consolidated income statement data for the first quarter of 2013, restated on a homogeneous basis for comparison with the first quarter of 2014 are presented in the next section of this Interim Report on Operations.
Operating and financial performance highlights
(amounts in millions of euros)
Salini Impregilo Group
The paragraph “Alternative performance indicators” in the “Other information” section provides a definition of the financial statement indicators used to present the Group’s financial highlights.
The income statement data for the first quarter of 2013 were reclassified in accordance with the requirements of IFRS 5; in addition, in that period the Impregilo Group was valued by the equity method The statement of financial position data at December 31, 2013 were reclassified due to the adoption of the new standards IFRS 10 and IFRS 11.
CONSOLIDATED INCOME STATEMENT
| (in milions of euros) | 1st quarter 2014 | 1st quarter 2013(§) |
|---|---|---|
| Revenue | 859.0 | 307.9 |
| Operating costs | (770.7) | (262.0) |
| Gross operating profit (EBITDA) | 88.3 | 45.9 |
| EBITDA % | 10.3% | 14.9% |
| Operating profit (EBIT) | 45.1 | 27.1 |
| R.o.S. | 5.2% | 8.8% |
| Financing income (costs) | (19.8) | (4.8) |
| Gains (losses) on investments | 3.8 | 20.3 |
| Earnings before taxes (EBT) | 29.1 | 42.7 |
| Income taxes | (9.6) | (7.2) |
| Profit (Loss) from continuing operation | 19.5 | 35.5 |
| Profit (Loss) from discontinued operation | 0.7 | (6.3) |
| Profit (Loss) for the period attributable to owners of the parent | 15.3 | 30.3 |
(§) The data for the first quarter of 2013 were reclassified in accordance with the requirements of IFRS 5; in addition, in that period the Impregilo Group was valued by the equity method.
CONSOLIDATED STATEMENT OF FINANCIAL POSITION
| (in milions of euros) | March 31, 2014 | December 31, 2013 (*) |
|---|---|---|
| Non-current assets | 827.7 | 843.1 |
| Non-current assets (liabilities) held for sale | 246.6 | 235.5 |
| Provisions for risks, post-employment benefits and other employee benefits | (123.9) | (125.5) |
| Other non-current assets (liabilities) | 7.7 | 7.8 |
| Tax assets (liabilities) | 104.3 | 81.2 |
| Working capital | 480.4 | 181.7 |
| Net invested capital | 1.542.8 | 1.223.9 |
| Shareholders’ equity | 908.8 | 892.1 |
| Net financial position | 634.1 | 331.7 |
(*) The statement of financial position data at December 31, 2013 were reclassified due to the adoption of the new standards IFRS 10 and IFRS 11.
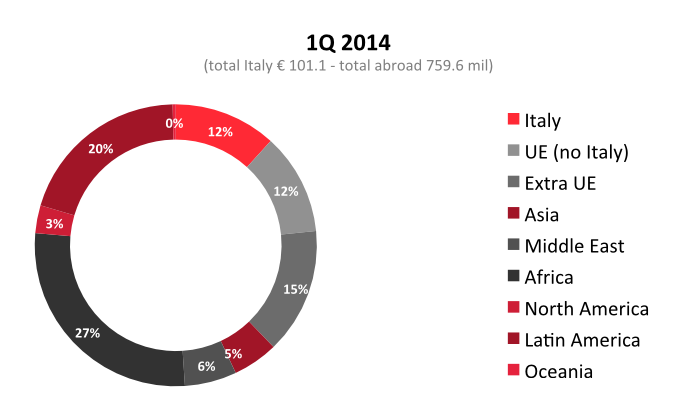
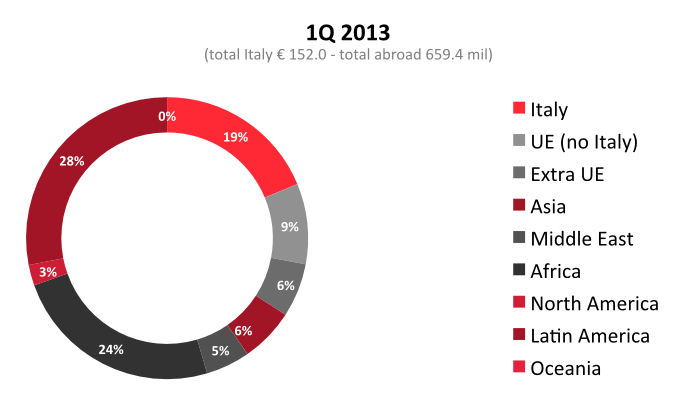
ORDER BACKLOG BY GEOGRAPHIC REGION
REVENUE BY GEOGRAPHIC REGION
