
After the completion of the merger between Salini and Impregilo in January 2014, we demonstrated our ability to integrate businesses, to create value for our shareholders and to achieve our business plan target, profit and enhancement of human resources.
Pietro Salini, CEO
Salini Impregilo
September 2015 - Construction backlog and revenues by geographic area
Construction backlog

italy 33%
Europe 9%
Americas 12%
Africa 22%
Asia & Australia 3%
Middle East 21%
9M 2015 Revenues
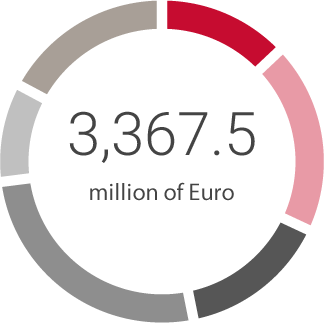
Italy 13%
Europe 19%
Americas 15%
Africa 26%
Asia & Australia 10%
Middle East 17%
Total Backlog Increase


Dec 2014
Sep 2015
Billion of Euro

2015 Guidance & Business Plan Targets

Reconfirmed 2014 –2017 Business Plan Targets
Download
| Milan, 14 November 2015 | Interim Report on Operations as at September 30 2015 | 0.5 Mb |  |
| Milan, 12 November 2015 | Consolidated Financial Results 9 Months 2015 | 0.5 Mb | |
| Milan, 12 November 2015 | 9 Months 2015 Financial Results & Strategy Evolution | 1.5 Mb | |
| Milan, 12 November 2015 | 9 Months 2015 Financial Results & Strategy Evolution - Conference Call |  |