Financial report
Sustainability report

The results achieved in the first quarter of 2015, in terms of growth and profitability, confirm a good start to the year for our Group. Effective management and the favorable trend in our reference market make us confident in reaching the targets set for the current year
Pietro Salini, CEO
Salini Impregilo
Highlights
€ 773.0 mln
vs. € 421.0 mln 1Q 2014
€ 1.0 bn
+14.4% vs. 1Q 2014
€ 214.1 mln
vs. 570.0 mln 1Q 2014
€ 117.0 mln
+27.1% vs. 1Q 2014
€ 61.8 mln
+28.5% vs. 1Q 2014
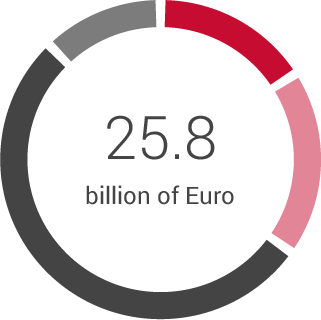
March 2015 - Total backlog €33 billion: of which €25.8 billion related to construction
March 2015 - Construction Backlog Breakdown

italy 35%
Europe 10%
Americas 12%
Africa 24%
Asia & Australia 2%
Middle East 16%

hydro & dam 16%
Roads and highways 18%
Rails & Underground 53%
Other 12%
Construction Backlog Evolution


25.3
Dec 2014
25.8
Mar 2015
billion of Euro
Financial data
Reclassified Income statement of Salini Impregilo Group
| Thousand € | 1st HALF 2015 | 1st HALF 2014(*) | Change |
|---|---|---|---|
| Operating revenue | 2,136,091 | 2,098,111 | 37,980 |
| Other revenue | 63,398 | 38,527 | 24,871 |
| Total revenue | 2,199,489 | 2,136,638 | 62,851 |
| Costs (**) | (1,970,183) | (1,939,280) | (30,903) |
| Gross operating profit | 229,306 | 197,358 | 31,948 |
| Gross operating profit % | 10.4% | 9.2% | |
| Amortisation and deprecation | (100,771) | (83,225) | (17,546) |
| Net operating profit (loss) | 128,535 | 114,133 | 14,402 |
| Return on Sales % | 5.8% | 5.3% | |
| Net financing costs | (22,561) | (90,656) | 68,095 |
| Net gains on investments | 1,211 | 1,704 | (493) |
| Net financing costs and net gains on investments | (21,350) | (88,952) | 67,602 |
| Profit (loss) before tax | 107,185 | 25,181 | 82,004 |
| Income tax expense | (35,256) | (9,569) | (25,687) |
| Profit (loss) from continuing operations | 71,929 | 15,612 | 56,317 |
| Profit from discontinued operations | (11,631) | 60,883 | (72,514) |
| Profit (loss) for the period | 60,298 | 76,495 | (16,197) |
| Non-controlling interests | (7,269) | 1,482 | (8,751) |
| Profit (loss) for the period attributable to the owners of the parent | 53,029 | 77,977 | (24,948) |
(§) economic data have been restated in accordance with IFRS 5 under the perimeter of Todini Costruzioni Generali sale. In addition, the restatement concerns the adoption of IFRS 10 and 11 as implemented in the consolidated financial statements at December 31, 2014.
(§§) provisions and impairment losses included
Reclassified Consolidated Statement of Financial Position of the Salini Impregilo Group
| Thousand € | 31 March 2015 | 31 December 2014 | Change |
|---|---|---|---|
| Non-current assets | 860.272 | 832.355 | 27.917 |
| Non-current assets held for sale. net | 103.905 | 84.123 | 19.782 |
| Provisions for risks | (100.426) | (97.527) | (2.899) |
| Post-employment benefits and employee benefits | (23.609) | (23.320) | (289) |
| Net tax assets | 165.118 | 148.698 | 16.420 |
| Inventories | 268.836 | 262.740 | 6.096 |
| Contract work in progress | 1.497.225 | 1.252.769 | 244.456 |
| Progress paymentsand advances on contract work in progress | (1.832.800) | (1.725.884) | (106.916) |
| Receivables* | 1.655.972 | 1.614.350 | 41.622 |
| Payables | (1.454.320) | (1.426.743) | (27.577) |
| Other current assets | 668.456 | 689.997 | (21.541) |
| Other current liabilities | (331.363) | (335.918) | 4.555 |
| Working capital | 472.006 | 331.311 | 140.695 |
| Net invested capital | 1.477.266 | 1.275.640 | 201.626 |
| Equity attributable to the owners of the parent | 1.187.206 | 1.109.903 | 77.303 |
| Non-controlling interests | 75.974 | 76.513 | (539) |
| Equity | 1.263.180 | 1.186.416 | 76.764 |
| Net financial position | 214.086 | 89.224 | 124.862 |
| Total financial resources | 1.477.266 | 1.275.640 | 201.626 |
(*) Receivables are shown net of €44.4 million (€65.9 million at December 31, 2014) classified in net financial position as the portion of net receivables pertaining to consortia and/or consortium companies over which no entity has control and operating under a cost recharging system, which corresponds to the Group’s share of cash and cash equivalents or financial debt with SPVs.
Net Financial Position of Salini Impregilo Group
| €/000 | 31 March 2015 | 31 December 2014 | Change |
|---|---|---|---|
| Non-current financial assets | 103,094 | 89,124 | 13,970 |
| Current financial assets | 144,844 | 156,908 | (12,064) |
| Cash and Cash equivalents | 955,689 | 1,030,925 | (75,236) |
| Total cash and cash equivalents and other financial assets | 1,203,627 | 1,276,957 | (73,330) |
| Bank and other loans | (442,461) | (456,209) | 13,748 |
| Bonds | (394,687) | (394,326) | (361) |
| Finance lease payables | (101,555) | (102,310) | 755 |
| Total non-current indebtedness | (938,703) | (952,845) | 14,142 |
| Current portion of bank loans and current account facilities | (291,531) | (247,522) | (44,009) |
| Current portion of bond issues | (173,670) | (166,292) | (7,378) |
| Current portion of finance lease payables | (51,951) | (60,231) | 8,280 |
| Total current indebtedness | (517,152) | (474,045) | (43,107) |
| Derivative liabilities | (6,331) | (5,244) | (1,087) |
| Net financial assets held by SPVs and unconsolidated project companies ** | 44,473 | 65,953 | (21,480) |
| Total other financial assets (liabilities) | 38,142 | 60,709 | (22,567) |
| Total net financial position – continuing operations | (214,086) | (89,224) | (124,862) |
| Net financial position for assets held for sale | (65,200) | (81,292) | 16,092 |
| Net financial position including non-current assets held for sale | (279,286) | (170,516) | (108,770) |
(**) This item recognizes the portion of net payables and receivables pertaining to consortia and/or consortium companies over which no entity has control and operating under a cost recharging system, which corresponds to the Group’s share of cash and cash equivalents or financial debt with SPVs. In the financial statements, the balances are included in Trade Receivables.
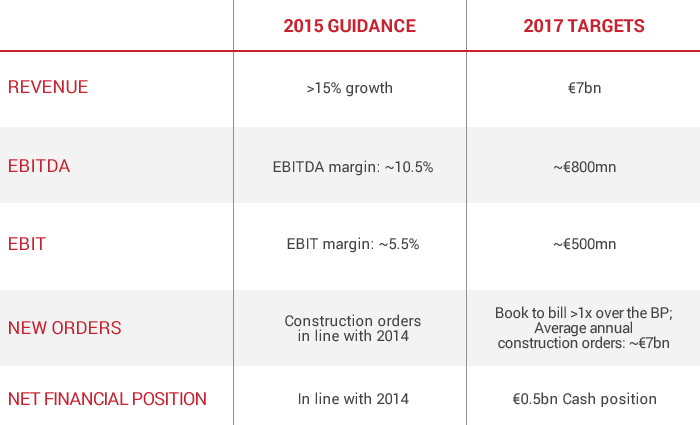
2015 Guidance & Business Plan Targets


