The voluntary public tender offer launched by Salini S.p.A. in the first half of 2013 for all Impregilo S.p.A. ordinary shares, resulted in an interest in the share capital of the latter company equivalent to 88.83% of the ordinary shares as at 31 December 2013.
The first subscription phase of the public tender offer was closed on 18 April 2013. On said date, Salini S.p.A. gained control over Impregilo S.p.A., which prior to that date had been accounted for as an associate.
In order to determine the scope of consolidation and in accordance with the provisions of IFRS 3, the acquisition date for accounting purposes was set on 1 April 2013.
As a result, the balance sheet data as at 31 December 2013 of the subsidiary Impregilo S.p.A. were fully consolidated in the financial statements of the Salini S.p.A. Group, whereas only the results for the second, third and fourth quarters of 2013 were consolidated in the income statement.
On 12 September 2013, as a part of this transaction, the extraordinary shareholders’ meetings of Salini S.p.A. and Impregilo S.p.A. approved the merger by incorporation of Salini S.p.A. into Impregilo S.p.A. The merger went into effect as of 1 January 2014 as a result of a share exchange ratio of 6.45 Impregilo ordinary shares to each Salini share, with no cash adjustments.
As from said date, the company resulting from the merger has taken the name of Salini Impregilo S.p.A.
In this Annual Report, for the purpose of consistent and uniform disclosure, reference to the previous company name is made for anything concerning management events prior to the effective date of the merger. A more extensive disclosure concerning the merger is provided in the documents made available to the public as required by the applicable provisions of law and regulations.
In accordance with IFRS 3, the company measured its controlling interest in Impregilo S.p.A. with the purchase price allocation (PPA) method, reporting assets and liabilities - including potential ones - at fair value at the acquisition date. This has resulted in a significant impact on the income statement in terms of revenues, non-core business, the calculation of taxes and the net result of discontinued operations, while the balance sheet was significantly impacted in terms of intangible assets, investments and tax payables.
Further details can be found in the paragraph on business combinations in the explanatory notes to the financial statements.
Finally, the net result of discontinued operations includes the consolidated data of the subsidiary Todini Costruzioni Generali S.p.A., which has been measured in this financial year in view of its disposal. In accordance with the provisions of standard IFRS 5, for the purpose of comparing the financial statements, the statement of income of the previous period was restated by classifying the investee’s consolidated data as at 31 December 2012 under the “Discontinued operations”.
| (Values in €/000) | December 2013 | December 2012 |
|---|---|---|
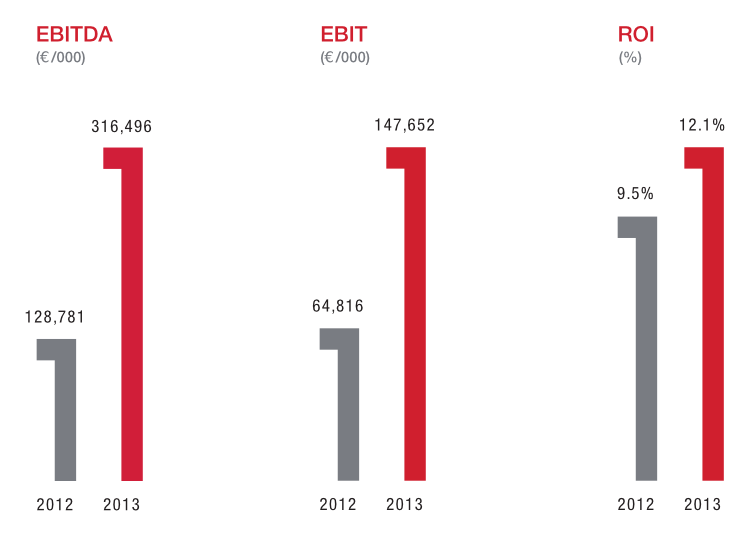
| Total revenues | 3,425,661 | 1,214,880 |
| EBITDA | 316,496 | 128,781 |
| EBITDA margin | 9.2% | 10.6% |
| EBIT | 147,652 | 64,816 |
| EBIT margin | 4.3% | 5.3% |
| EBT | 289,075 | 349,181 |
| EBT margin | 8.4% | 28.7% |
| Net profit attributable to the Group | 166,944 | 324,968 |
| Total fixed assets | 777,137 | 946,101 |
| Operating working capital | 336,999 | (243,954) |
| Non-current assets held for sale | 653,604 | 0 |
| Non-current liabilities held for sale | (418,061) | 0 |
| Reserves | (125,688) | (18,752) |
| NET INVESTED CAPITAL | 1,223,991 | 683,395 |
| Shareholders’ equity | (892,283) | (588,340) |
| Net financial payables | (331,708) | (95,005) |
| FUNDING | (1,223,991) | (683,395) |
| Net Debt / Equity | 0.37 | 0.16 |
| Net Debt / EBITDA | 1.05 | 0.74 |
| ROS (Return on Sales) | 4% | 5% |
| ROI (Return on Investments) | 12% | 9% |
| Current Asset Ratio | 1.6 | 1.4 |
NB. The 2013 figures were consolidated with the balance sheet and income statement data (from 1 April 2013) of the Impregilo Group, whereas the 2012 figures regarded the Salini S.p.A. Group alone, being its first stand-alone year.
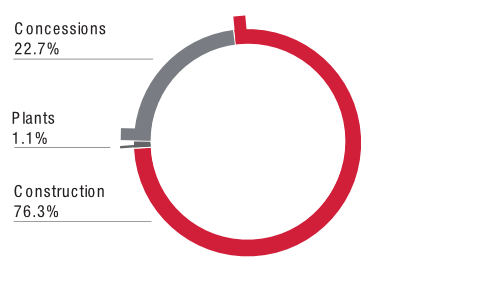
Portfolio of work in hand by sector
| (€/000) | DEC2013 | DEC2012 | ||
|---|---|---|---|---|
| Construction | 21,988,015 | 76.3% | 19,939,115 | 75.3% |
| Concessions | 6,533,660 | 22.7% | 6,260,723 | 23.7% |
| Plants | 309,464 | 1.1% | 271,874 | 1.0% |
| 28,831,139 | 26,471,712 |
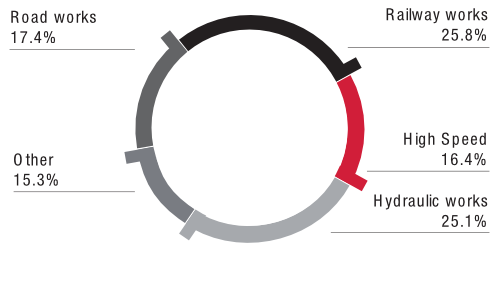
Construction portfolio of work in hand
| (€/000) | DEC 2013 | DEC 2012 | ||
|---|---|---|---|---|
| Railways | 5,675,811 | 25.8% | 4,493,205 | 22.5% |
| High-speed railways | 3,616,708 | 16.4% | 3,195,684 | 16.0% |
| Hydraulic works | 5,518,057 | 25.1% | 6,108,364 | 30.6% |
| Miscellaneous works | 3,355,850 | 15.3% | 3,145,201 | 15.8% |
| Road works | 3,821,589 | 17.4% | 2,996,661 | 15.0% |
| 21,988,015 | 19,939,115 |
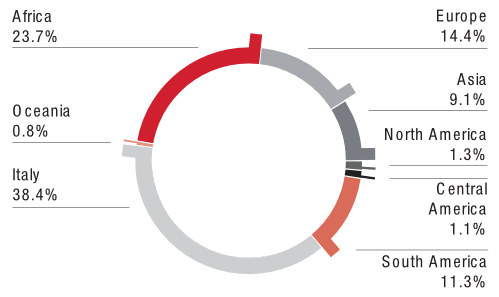
Portfolio of work in hand by geographical area
| (€/000) | DEC 2013 | DEC 2012 | ||
|---|---|---|---|---|
| Africa | 6,841,843 | 23.7% | 6,737,317 | 25.5% |
| Europe | 4,139,939 | 14.4% | 3,082,093 | 11.6% |
| Asia | 2,617,851 | 9.1% | 1,215,625 | 4.6% |
| North America | 366,883 | 1.3% | 350,364 | 1.3% |
| Central America | 331,537 | 1.1% | 629,870 | 2.4% |
| South America | 3,245,558 | 11.3% | 3,671,589 | 13.9% |
| Italy | 11,069,898 | 38.4% | 10,784,855 | 40.7% |
| Oceania | 217,630 | 0.8% | - | - |
| 28,831,139 | 26,471,712 |
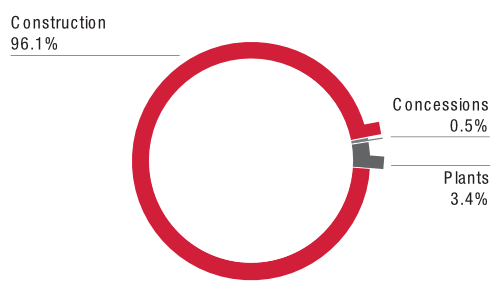
Operating revenues by sector
| (€/000) | DEC 2013 | DEC 2012 | ||
|---|---|---|---|---|
| Construction | 3,205,360 | 96.1% | 1,174,185 | 100.0% |
| Concessions | 15,719 | 0.5% | - | - |
| Plants | 112,741 | 3.4% | - | - |
| SUW | - | 0.0% | - | - |
| 3,333,820 | 1,174,185 |
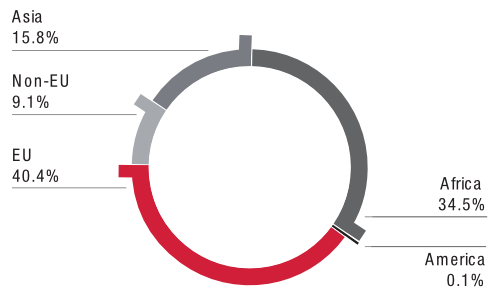
Operating revenues by geographical area
| (€/000) | DEC 2013 | DEC 2012 | ||
|---|---|---|---|---|
| EU | 997,709 | 40.4% | 304,222 | 25.9% |
| Non-EU | 225,616 | 9.1% | 37,156 | 3.2% |
| Asia | 390,987 | 15.8% | 254,561 | 21.7% |
| Africa | 850,382 | 34.5% | 578,246 | 49.2% |
| America | 3,063 | 0.1% | - | - |
| 2,467,757 | 1,174,185 |
Summary personnel figures
| (€/000) | DEC 2013 |
|---|---|
| Personnel costs | 459,443 |
| Number of employees | 31,172 |
