Salini Impregilo Group
The paragraph "Alternative performance indicators" in the "Other information" section gives a definition of the financial statements indicators used to present the group’s highlights.
The income statement data for 2013 have been reclassified due to the adoption of the new IFRS 10 and 11 standards and in accordance with the provisions of IFRS 5, also including the line-by-line consolidation of Impregilo only from the start of the second quarter. The statement of financial position data at December 31, 2013 has been reclassified due to the adoption of the new standards IFRS 10 and 11.


Consolidated income statement
| (in millions of euros) | 2014 | 2013 (§) |
|---|---|---|
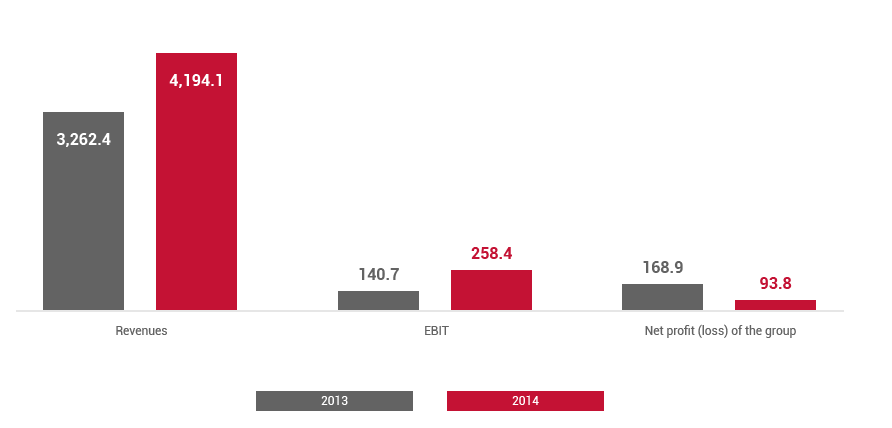
| Revenue | 4,194.1 | 3,262.4 |
| Operating costs | (3,758.2) | (2,987.5) |
| Gross operating profit (EBITDA) | 435.9 | 274.9 |
| EBITDA % | 10.4% | 8.4% |
| Operating profit (EBIT) | 258.4 | 140.7 |
| R.o.S. | 6.2% | 4.3% |
| Financing income (costs) | (142.0) | (58.0) |
| Gains (losses) on investments | 9.0 | 195.1 |
| Earnings before taxes (EBT) | 125.3 | 277.9 |
| Income taxes | (39.6) | (19.5) |
| Profit (loss) from continuing operations | 85.7 | 258.4 |
| Profit (loss) from discontinued operations | 17.4 | (102.1) |
| Profit (loss) for the period attributable to the owners of the parent | 93.8 | 168.9 |
(§) The income statement data for 2013 were reclassified following the adoption of the new standards IFRS 10 and 11 and in accordance with the provisions of IFRS 5. Furthermore, Impregilo has been consolidated using the line-by-line method only from the start of the second quarter 2013.
Consolidated statement of financial position
| (in millions of euros) | December 31, 2014 | December 31, 2013 * |
|---|---|---|
| Non-current assets | 832.4 | 698.5 |
| Non-current assets (liabilities) held for sale | 84.1 | 235.5 |
| Provisions for risks, post-employment benefits and employee benefits | (120.8) | (197.9) |
| Tax assets (liabilities) | 148.7 | 141.6 |
| Working capital | 331.3 | 254.1 |
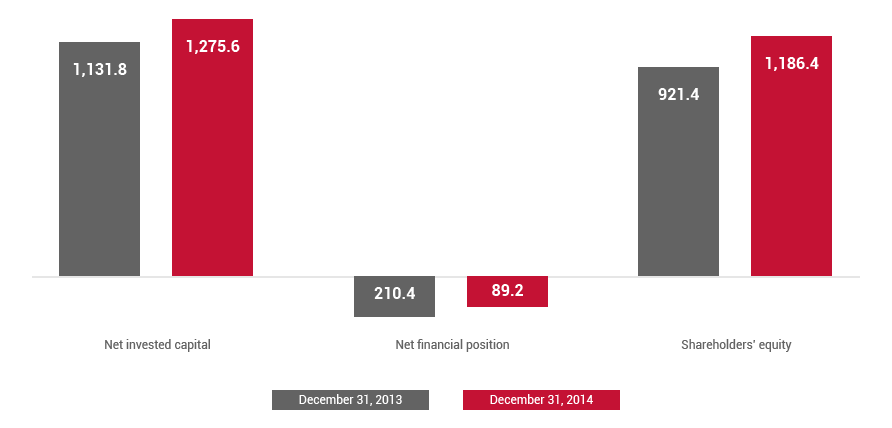
| Net invested capital | 1,275.6 | 1,131.8 |
| Shareholders’ equity | 1,186.4 | 921.4 |
| Net financial position | 89.2 | 210.4 |
(*) The statement of financial position data at December 31, 2013 have been reclassified due to the adoption of the new standards IFRS 10 and IFRS 11.
Salini Impregilo S.p.A. Income Statement
| (in millions of euros) | 2014 | 2013 (§) |
|---|---|---|
| Revenue | 2,341.9 | 1,274.1 |
| Operating costs | (2,116.0) | (1,101.2) |
| Gross operating profit (EBITDA) | 225.9 | 172.9 |
| EBITDA % | 9.6% | 13.6% |
| Operating profit (EBIT) | 125.9 | 153.1 |
| R.o.S. | 5.4% | 12.0% |
| Financing income (costs) | (113.3) | 26.8 |
| Gains (losses) on investments | 28.8 | (13.2) |
| Earnings before taxes (EBT) | 41.4 | 166.7 |
| Income taxes | (10.7) | (50.2) |
| Profit (loss) from continuing operations | 30.7 | 116.5 |
| Profit (loss) for the period attributable to the owners of the parent | 30.7 | 116.5 |
(§) The income statement data for 2013 have been reclassified following the adoption of the new standard IFRS 11 and refer to the separate financial statements of Impregilo S.p.A.
Salini Impregilo S.p.A. Statement of Financial Position
| (in millions of euros) | December 31, 2014 | December 31, 2013 (*) | |
|---|---|---|---|
| Non-current assets | 1,055.5 | 549.2 | |
| Provisions for risks, post-employment benefits and employee benefits | (48.3) | (145.9) | |
| Tax assets (liabilities) | 18.6 | (13.1) | |
| Working capital | 459.7 | 648.7 | |
| Net invested capital | 1,485.6 | 1,038.9 | |
| Shareholders’ equity | 943.0 | 1,193.8 | |
| Net financial position | 542.6 | (155.0) | |
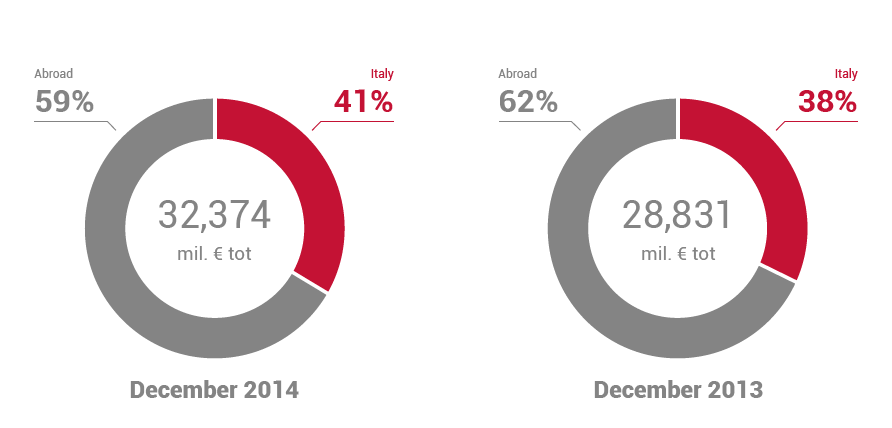
Order backlog by geographic region

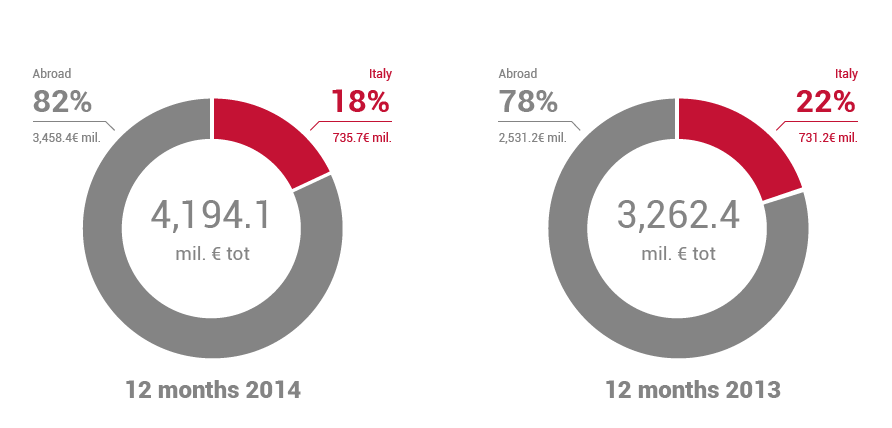
Revenue by geographic region

